Reading Crypto Charts: How-to Guide for 2024
 Fact-checked
Last Updated: February 13, 2024
What Is the Dow Theory?
What Is Technical Analysis?
Time Frames for Crypto Charts
How to Calculate Market Cap
What Are Crypto Candlestick Charts?
What Are the Symbolic Meanings of Each of These Candlesticks?
What Is the Relative Strength Index?
What Are Support and Resistance?
Why Is Understanding a Crypto Chart Important?
If you want to dive into the world of cryptocurrency trading, you’ll need to learn how to read crypto charts. For newcomers, the technical analysis (TA) that comes with these charts might be somewhat confusing.
Learning technical analysis and all the language that comes with it is a scary thought. To make the concepts easier to understand, this comprehensive guide is filled with definitions. We have used layman’s language for more challenging concepts. Finally, don’t forget to check out our interesting facts and FAQs as a bonus.
How to Read Crypto Charts
You need to know how to read these types of charts if you want to start trading cryptocurrencies and turning your Bitcoin into cash; you can also do this through some of the popular bitcoin trading sites. If you’re going to make successful crypto trades, you must perform competent technical analysis based on the Dow Theory.
What Is the Dow Theory?
The Dow Theory, at its most basic level, describes market movements and how they usually act. It generates signals that can be utilized to determine the main market trend, even through live crypto charts. Trading decisions are based on this basic market trend.
Dow Theory is based on a few key concepts. When it comes to pricing, the market considers everything. All previous, present, and forthcoming information has already been included in asset values.
Multiple aspects, including current, past, and future demand (plus any restrictions that may affect the crypto market) are considered when it comes to crypto price charts. Price changes aren’t entirely random. They are more likely than not to follow patterns, which might be lengthy or short-term.
Market experts are more concerned with the price of a coin itself, rather than every circumstance that influences its price. Market behavior can be predicted because traders react the same way whenever they see a particular trend.
Six basic tenets of Dow Theory are necessary to know how to read real-time crypto charts.
Three Market Movements
- The major and main movement of a market is referred to as such. These are market trends that can continue anywhere between a year and several years. The primary trend might be a bullish movement or a bearish movement.
- The medium swing is a secondary or intermediate reaction that can last anywhere from ten to three months. It typically retraces between 33% and 66% of the main price change.
- Finally, we have the brief swing or minor movement, which can last anywhere from a few hours to a month or more, depending on market speculation.
Crypto market charts show these market trends that will only be noticeable if you know them well. A daily minor movement in a bearish secondary response with a bullish primary movement, for example, can occur simultaneously as these three movements.
Three Market Trends and Phases
- The accumulation phase is when educated investors begin buying or selling crypto despite the market’s common impression. Since these knowledgeable investors are in the minority, the asset price in the crypto price chart does not fluctuate substantially throughout this stage.
- The public involvement phase, often referred to as the absorption phase, occurs when the rest of the market follows experienced investors. As more people become aware of these phenomena, conjecture becomes prevalent.
- The distribution phase takes place after the absorption phase’s conjecture. Investors who are well-versed in the market begin to redistribute their assets. After a period of intense speculation, the price begins to retrace as knowledgeable investors begin to distribute their holdings to the market due to the asset’s limited supply. As a result, prices noticeable in crypto market charts begin to fall in tandem with volume.
New Information Is Discounted
As soon as new information becomes available, it is reflected on the stock market. It represents the aggregate of all market players’ aspirations, concerns, and expectations. Once the news is out, the asset’s price may alter to reflect the information in the crypto price chart. Interest rate movements, earnings predictions, and other factors are all factored into the market price.
The Averages of the Stock Market Must Agree
Let’s see how this works with a simple example. There are two companies: A and B. Let’s say you are a sustainable toy seller [company A], and you have connections with someone who provides you with raw materials [company B] specifically for this kind of toy making.
Since sustainable toys are so rare but popular, your business is continuously expanding. Due to your whole process of toy-making depending on the raw materials (on company B) it is imperative that the growth of your business is reflected as growth in company B’s business.
Let’s also assume that someone wants to invest in your business. As a result, before investing in your company, the interested person would have to assess the performance of your raw materials provider.
For the person to invest, the averages of both the companies need to show the same direction trends. If the averages diverge, the investor won’t invest because the trend will ultimately reverse.
The Volume Confirms Trends
According to Dow Jones, volume is a secondary yet crucial aspect in understanding price in a BTC graph. In the time of large trends, volume reacts like this:
- With an uptrend, the volume should rise in tandem with the price
- During a decline, volume decreases as the price falls
| Did You Know? The relationship between price and volume development indicates whether volume confirms the overall trend or signals an impending reversal. The finest instrument for undertaking a detailed short-term volume study is candlestick analysis or bitcoin chart analysis, which can help you answer “How much should I invest in Bitcoin?” |
What Is Technical Analysis?
Timing the market is a frequent issue faced by many rookie traders. Cryptocurrency charts are required if you want to have precise opening price points and exit locations. You could have a fantastic trading strategy and believe that Bitcoin is set to rise, but if you select the wrong spot, you’ll lose money left and right.
If you leave too soon or too late, you may be leaving money on the table as well. Luckily, you can counteract this by using crypto charts in conjunction with technical analysis.
The strategy used to predict a cryptocurrency’s probable price movements in the future is called technical analysis. Technical analysis trading forecasts the market using charts and other indicators. It can be a fun and exciting procedure that helps you gain a thorough understanding of the market.
The following are the three key principles of technical analysis:
- Everything is discounted in the market price activity. As a result, the fair market price is wherever the market is now trading. The price takes into account all of the hopes, anxieties, and market expectations.
- Markets move in predictable patterns. The marketplaces take a long time to reach their destination.
- The third premise is that history tends to repeat itself, which means that price levels in the past can often be critical in the future. This is why technical analysis would always include analysis of the bitcoin historical chart.
- A technical analysis strategy isn’t a magic formula that can predict every market swing. Technical analysis trading is sometimes misunderstood by traders to make money rapidly, which is not the case.
| Did You Know? Technical analysis is a crucial part of cryptocurrency strategy. It is also important to understand how to read bitcoin charts; if you don’t, the world of cryptocurrency might swallow you! |
Time Frames for Crypto Charts
Different time frames on a bitcoin price chart can provide you with various information. For bitcoin charts, you may choose from a variety of time frames. You would look at the short period charts if you wanted to open and close your trade in a single day. Long-period charts are what you’d look at if you’re a long-term investor. This is an important aspect of crypto technical analysis.
- 15-minute chart: Each one is a 15-minute chart, which means each candle represents 15 minutes whether you’re seeking locations to manage the tradeoff between targets and stop-loss exits.
- Hourly chart: This is the most commonly used time frame. Depending on your trading style and preferences, you can have charts as low as tick charts and plot price every second.
- 4-hour chart: The 4-hour chart is particularly important, as the majority of crypto markets are open for 8 to 9 hours each day.
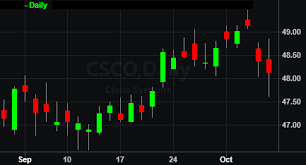
- Daily chart (1-Day): A daily chart displays data points, each of which reflects the price action of security for a single trading day in crypto live charts.
A trader’s choice of time is strongly related to their unique trading strategy. Traders are divided into two groups:
- Intraday Traders – Intraday traders are those that establish and cancel positions within a single trading day. As the name and definition suggest, the intraday traders use charts of a short timeframe, such as hourly charts.
- Long-Term Holders – Long-term holders might keep their spot for weeks, months, or even years. Hourly, 4-hour, daily, or weekly charts are more valuable to these investors. A 15-minute chart may be a crucial indicator for intraday traders, but it may not be so for long-term investors.
| Did You Know? Analyzing a cryptocurrency graph based on time frames depends on the kind of trader you are. Many other styles of trading are prevalent along with intraday and long term. Time also plays a major role even if you are using some of these great crypto gambling websites. |
How to Calculate Market Cap
Market capitalization is a reliable predictor of stability and can be analyzed using a cap and trade graph. It is computed by multiplying the entire circulating supply of the currency by the price of each coin. The more stable a coin is, the more consistent its market cap value is.
This formula is used to calculate a coin’s market capitalization:
Market cap = Total Circulating Supply × Price of each coin
| Did You Know? Since it reflects what investors are prepared to pay for a stock, the market cap evaluates what a firm is worth on the open market, as well as the market’s view of prospects. You should know more about the top-rated software for crypto tax for advanced analysis. |
What Are Crypto Candlestick Charts?
Crypto candlestick charts are by far the most popular charts available. There’s a good possibility you’ve seen these if you’ve ever visited an exchange’s website:
What Are the Symbolic Meanings of Each of These Candlesticks?
In addition to the closing price, each candle shows the starting point of prices, the lowest and highest prices of the chosen period, and the closing price. The two types of candlesticks that you can see in the picture above are called green and red candles. Candlestick charts are a major part of reading crypto charts.
Every candle has a main body in either of the colors. You can also see single lines protruding from above and below the main body, called shadows. The body shows the opening and closing prices, and the shadows depict how high or low these starting and closing prices have risen or fallen.
The close price is shown by the top shadow of the green candle, and the open price is shown by the lower shadow of the green candle. It is just the opposite when it comes to red candlesticks.
Knowing the different parts of the candle body is important for understanding how to read candlestick charts crypto.
Each candle on a candlestick chart represents the asset’s price movements over a defined time. They’re shaped like box-and-whisker charts and work in the same way. The top whisker (also known as a shadow) represents the asset’s highest price throughout the time interval. The difference between the asset’s opening and closing prices during the time interval is displayed in the box (known as the body).
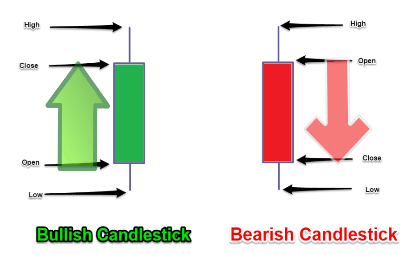
A bullish candlestick and bearish candlestick are the two varieties of candlesticks that can be seen in a crypto candlestick chart. Green will be used to represent a bullish candlestick. In a bullish candlestick, the asset’s ending price is higher than its initial price. Red will be used to represent a bearish candlestick. The initial price of a bearish candlestick will be greater than the asset’s closing price.
| Did You Know? At a glance, the color and length of the candles can assist in establishing whether the market is bearish (weakening) or bullish (increasing). The forecast market direction and predict market turning points ahead of time. Candlesticks, as a whole, offer various perspectives. |
What Is the Relative Strength Index?
The Relative Strength Index (RSI) is a mathematical formula that calculates the strength and speed of a cryptocurrency’s market price. It is a comparison of a cryptocurrency’s current price to its previous performance.
Remember that the RSI varies from 0 to 100 while examining the RSI graph of a certain currency, such as in an altcoin chart. When a coin’s RSI approaches or crosses 70, it is termed overbought. If the RSI falls below 30, the crypto is considered undervalued.
The Relative Strength Index, or RSI, determines the strength and speed of a market’s price movements by comparing the present price to its previous performance. It determines if crypto has been overbought or oversold by comparing the magnitude of recent gains to recent losses.
The formula looks like this:
RSI = 100 – (100/(1-RS))
While the RSI is a useful indicator, it is not immune to misleading buy and sells signals, which can be caused by a huge rally or a significant decrease in the cryptocurrency’s price. This is why you should use RSI in conjunction with other indicators to forecast a coin’s future price.
| Did You Know? RSI analyses the pace and change of market movements. It’s a leading indicator that Technical Analysts use all around the world. It is an important part of crypto technical analysis. |
What Are Support and Resistance?
When it comes to interpreting bitcoin candlestick charts, support and resistance levels are key. These are predefined levels that indicate a trend reversal. Generally, traders purchase at support levels and sell at resistance levels.
A support level is produced when the price of a crypto asset stops falling after reaching a certain point. However, if the sellers maintain their pace, the price will shatter the previous support level, forming a new one.
When the price of a crypto asset stops rising, a resistance level is formed. The resistance level can be broken if the buyers generate enough impetus.
When the price bounces off of a support level, the price rises, as reflected in crypto market charts, when long traders add additional money to the market to improve their position, this happens. Short traders also attempt to buy-in. Newer traders who haven’t yet entered the market may wait for a breakthrough at the support level.
Why Is Understanding a Crypto Chart Important?
To trade cryptocurrencies, you’ll need to know how to interpret crypto charts. To execute successful cryptocurrency trades, you must perform competent technical analysis based on the Dow Theory. You must be able to interpret candlestick charts and discern resistance and support levels. You’ll have the best chance of predicting market trends if you can read market emotions in this way.
FAQ
The top line of the red candlestick (bearish red candlestick) in a crypto chart represents the day’s top price.
The binance chart is made up of 1-day candlesticks. There are bars along the bottom that show the volume for each hour. High buying volume is represented by green bars, while high selling volume is represented by red bars. Some charts require advanced readings.
Buy or sell walls, also known as bid or ask walls, are a basic notion that can assist you in making better selections when placing orders. A trade is made when orders on both sides of the book match at a given price point, and the instrument’s price is established. If the purchase and sell sides of the order don’t match, the order is left unfulfilled until another order comes in that day.
Volume refers to the total number of real trades, whereas liquidity refers to the quantity of money available for trading at any given price. The more bitcoin transactions there are, the more liquid the crypto market becomes.
You can use bitcoin technical analysis to look at statistical trends and past volume and activity – including price movements and swings – to make educated forecasts about where the price will go in the short and long term. Technical analysis is the two-word answer for how to read crypto charts.


![How to Find Someone’s Tinder Profile? [2024 Expert Guide]](https://review42.com/wp-content/uploads/2023/06/Finding-Someone-on-Tinder.jpg)